Skip to content
Data storytelling

The operating model, in one look each

Five ways of showing the same underlying claim — that field-level disorder is measurable, and that measuring it changes the outcome.
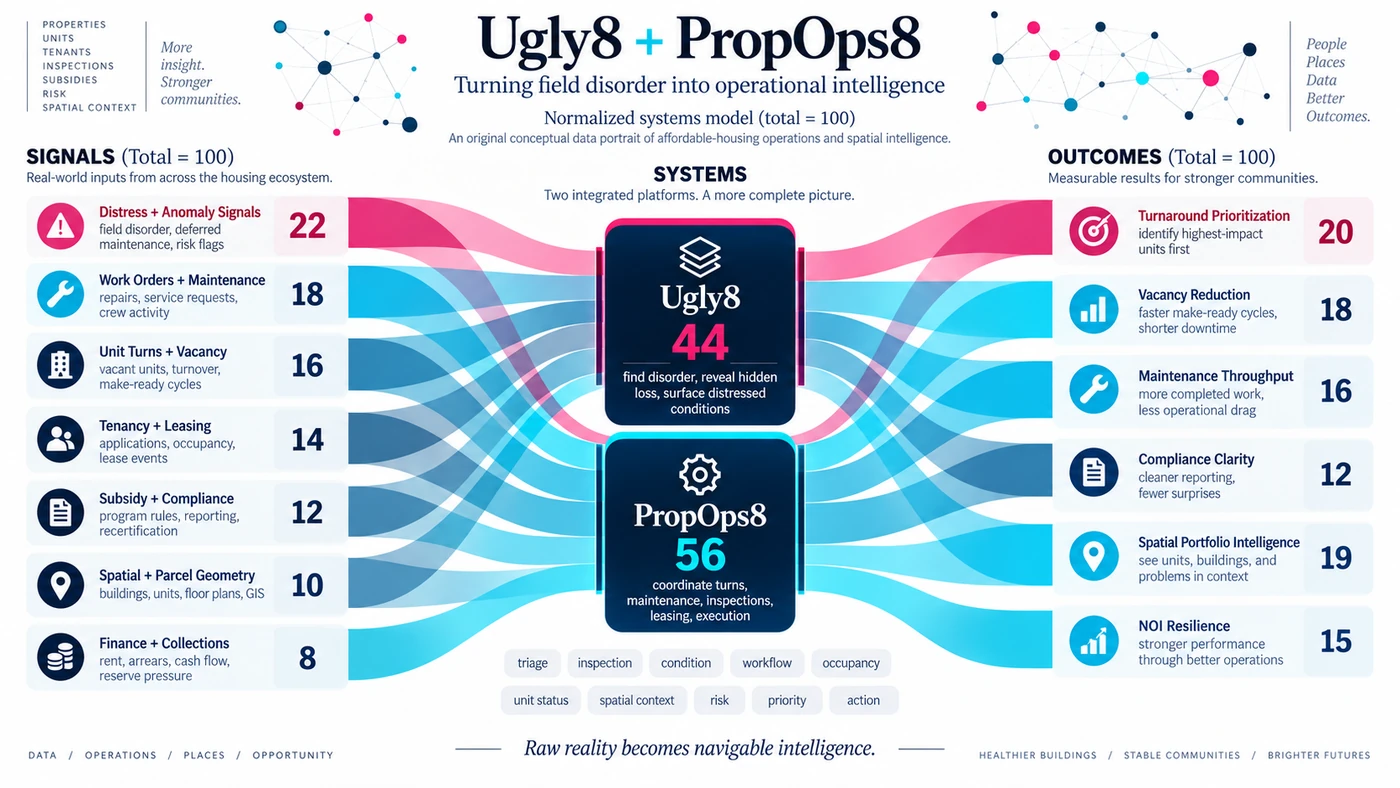
Sankey diagram showing housing-ecosystem signals flowing through Ugly8 and PropOps8 into measurable outcomes
Ugly8 + PropOps8: signals, systems, outcomes
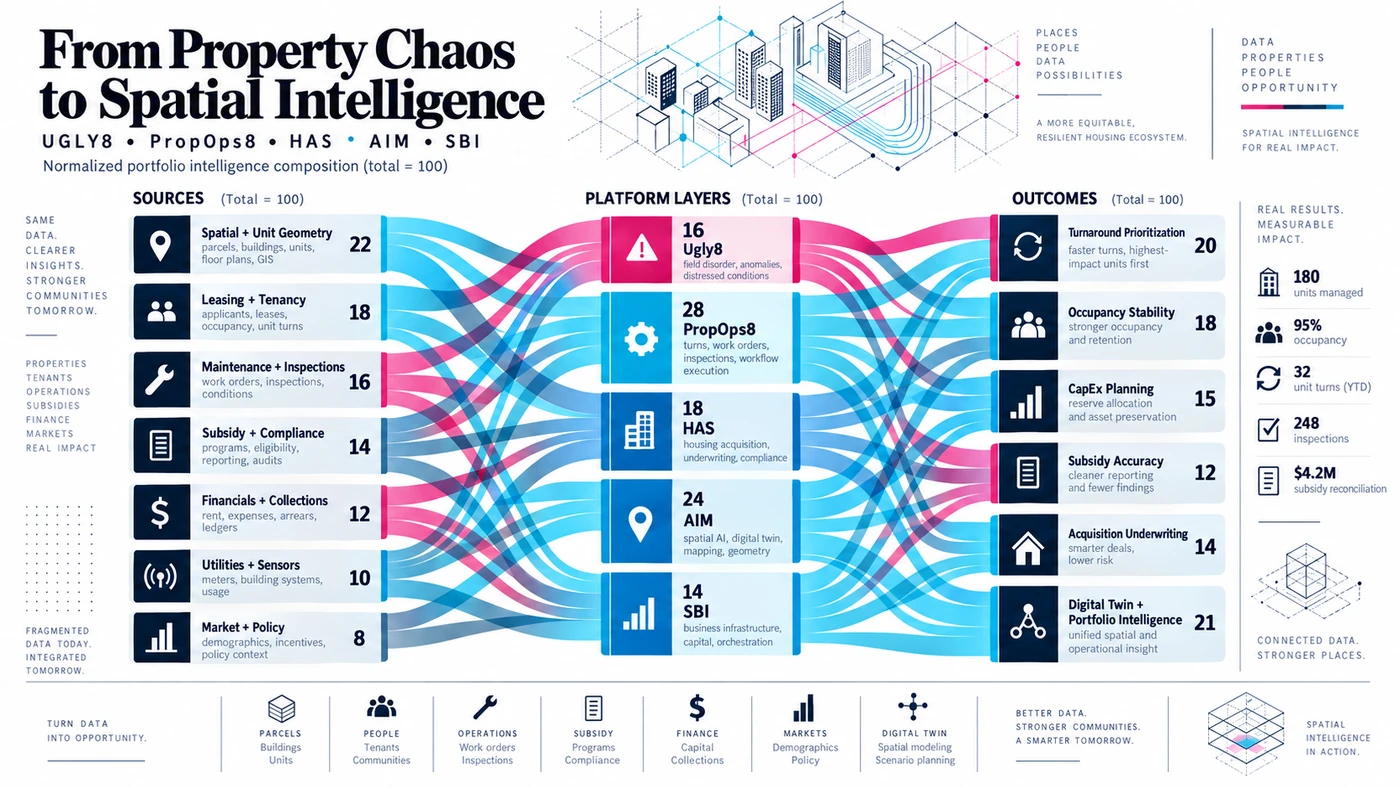
Sankey diagram showing five platform layers (Ugly8, PropOps8, HAS, AIM, SBI) converting sources into outcomes
From property chaos to spatial intelligence
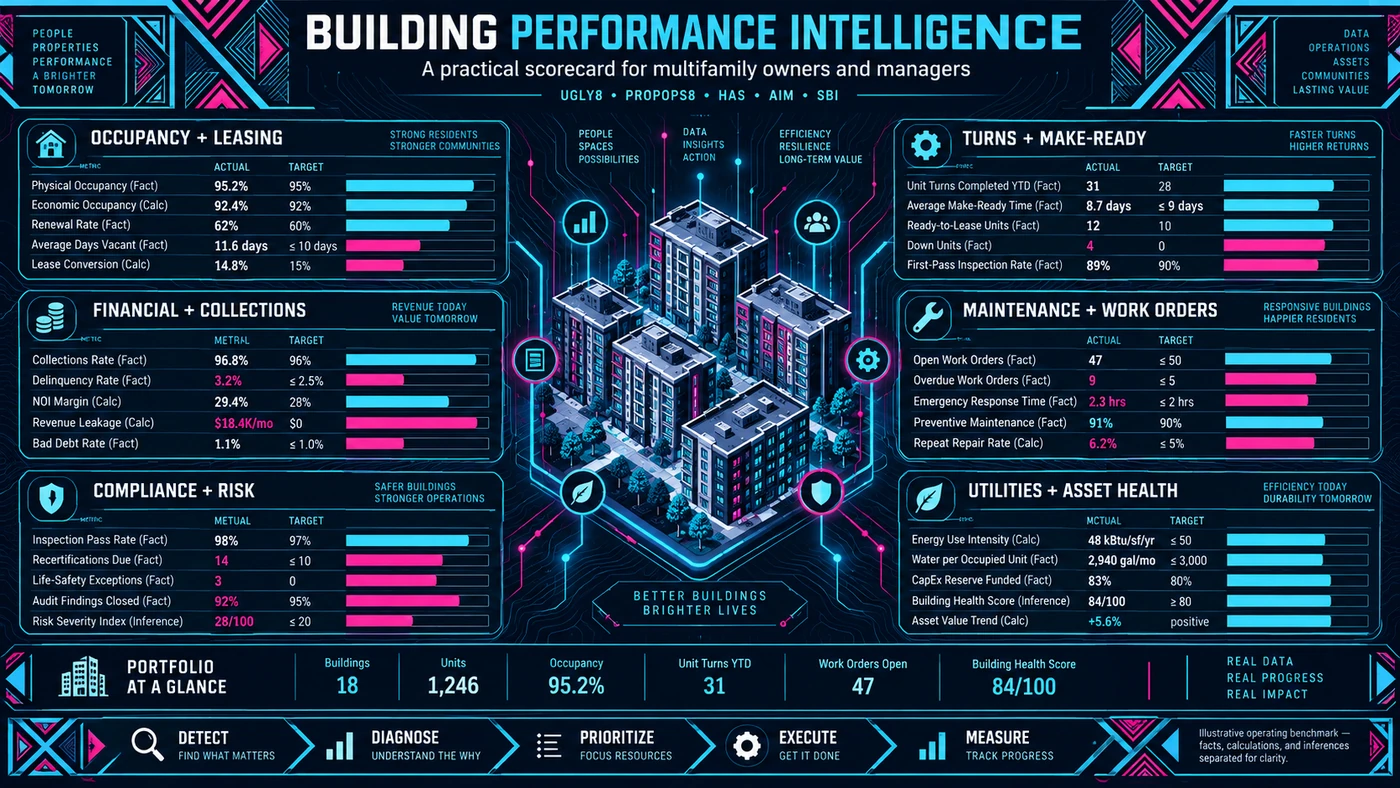
Six-panel scorecard covering occupancy, financials, compliance, turns, maintenance, and utilities
Building performance intelligence scorecard
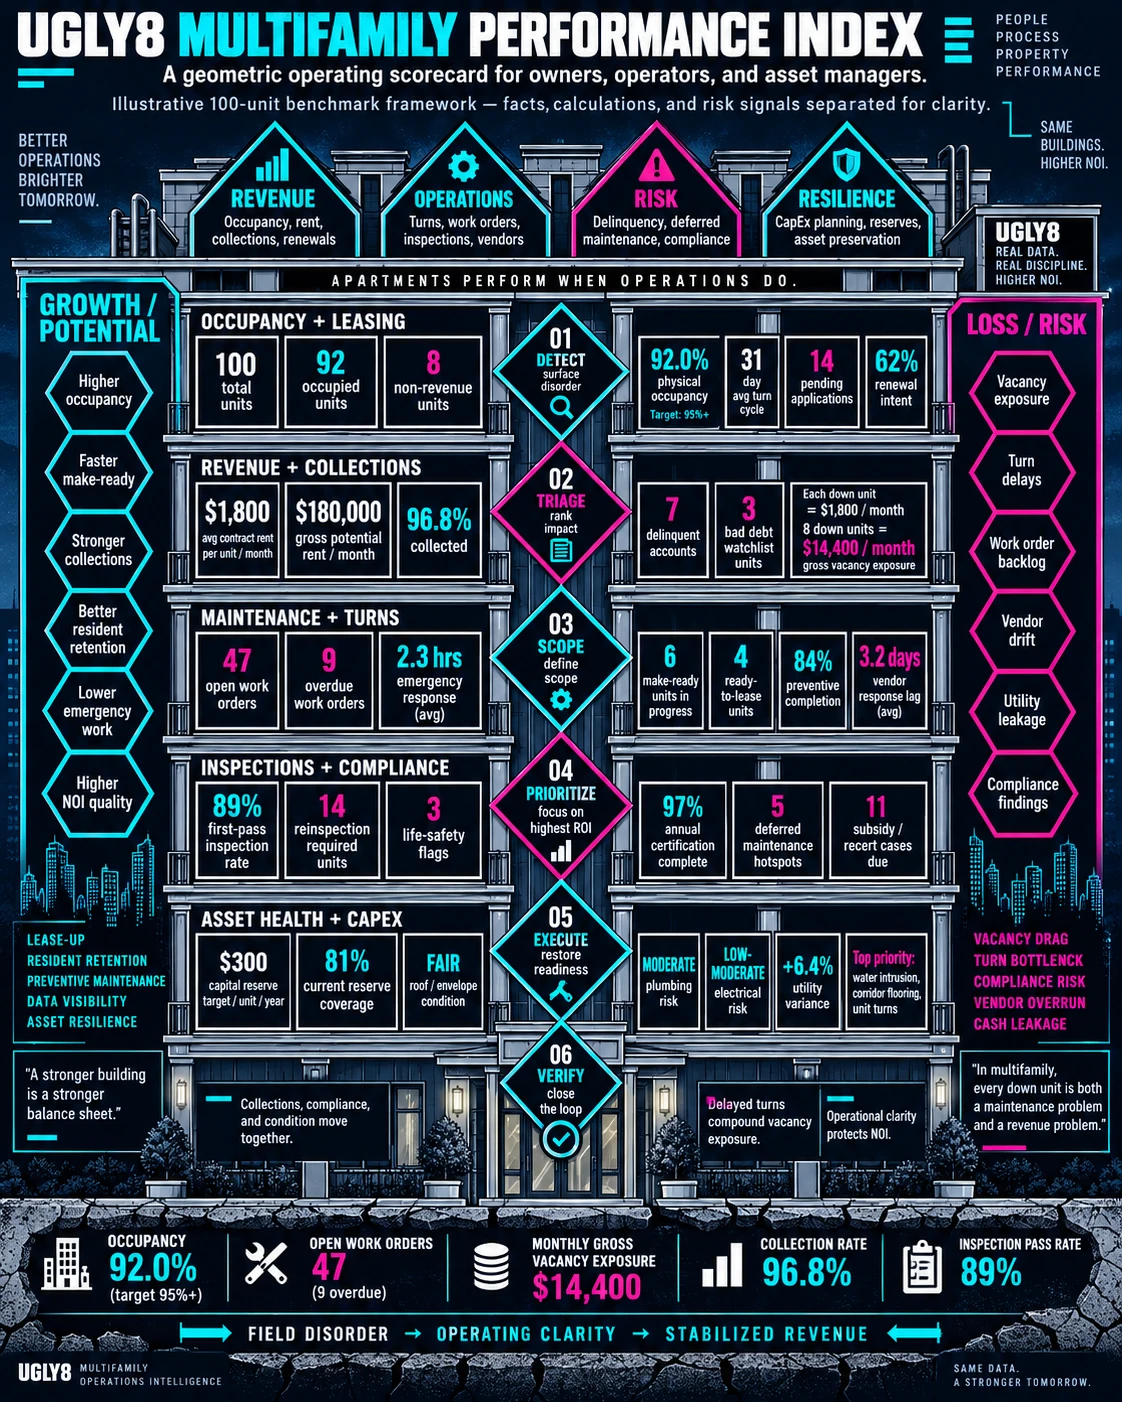
Building-facade styled scorecard with a detect-triage-scope-prioritize-execute-verify workflow
Ugly8 multifamily performance index
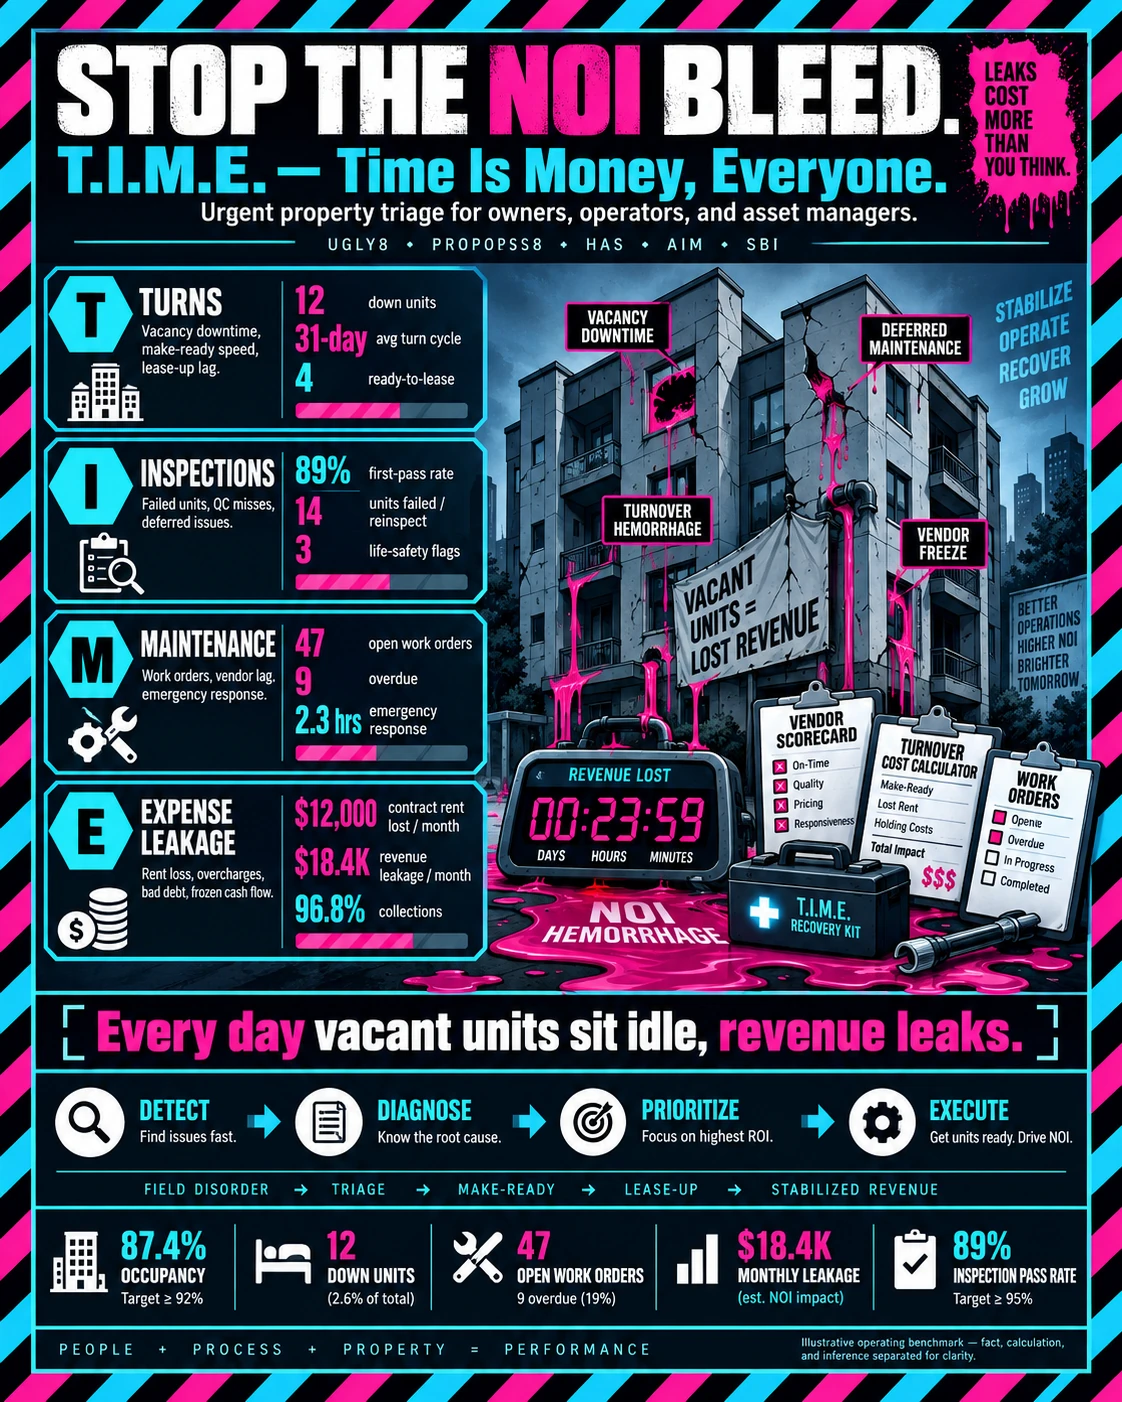
Turns, Inspections, Maintenance, Expense-leakage triage infographic with a detect-diagnose-prioritize-execute flow
Stop the NOI bleed — T.I.M.E. triage